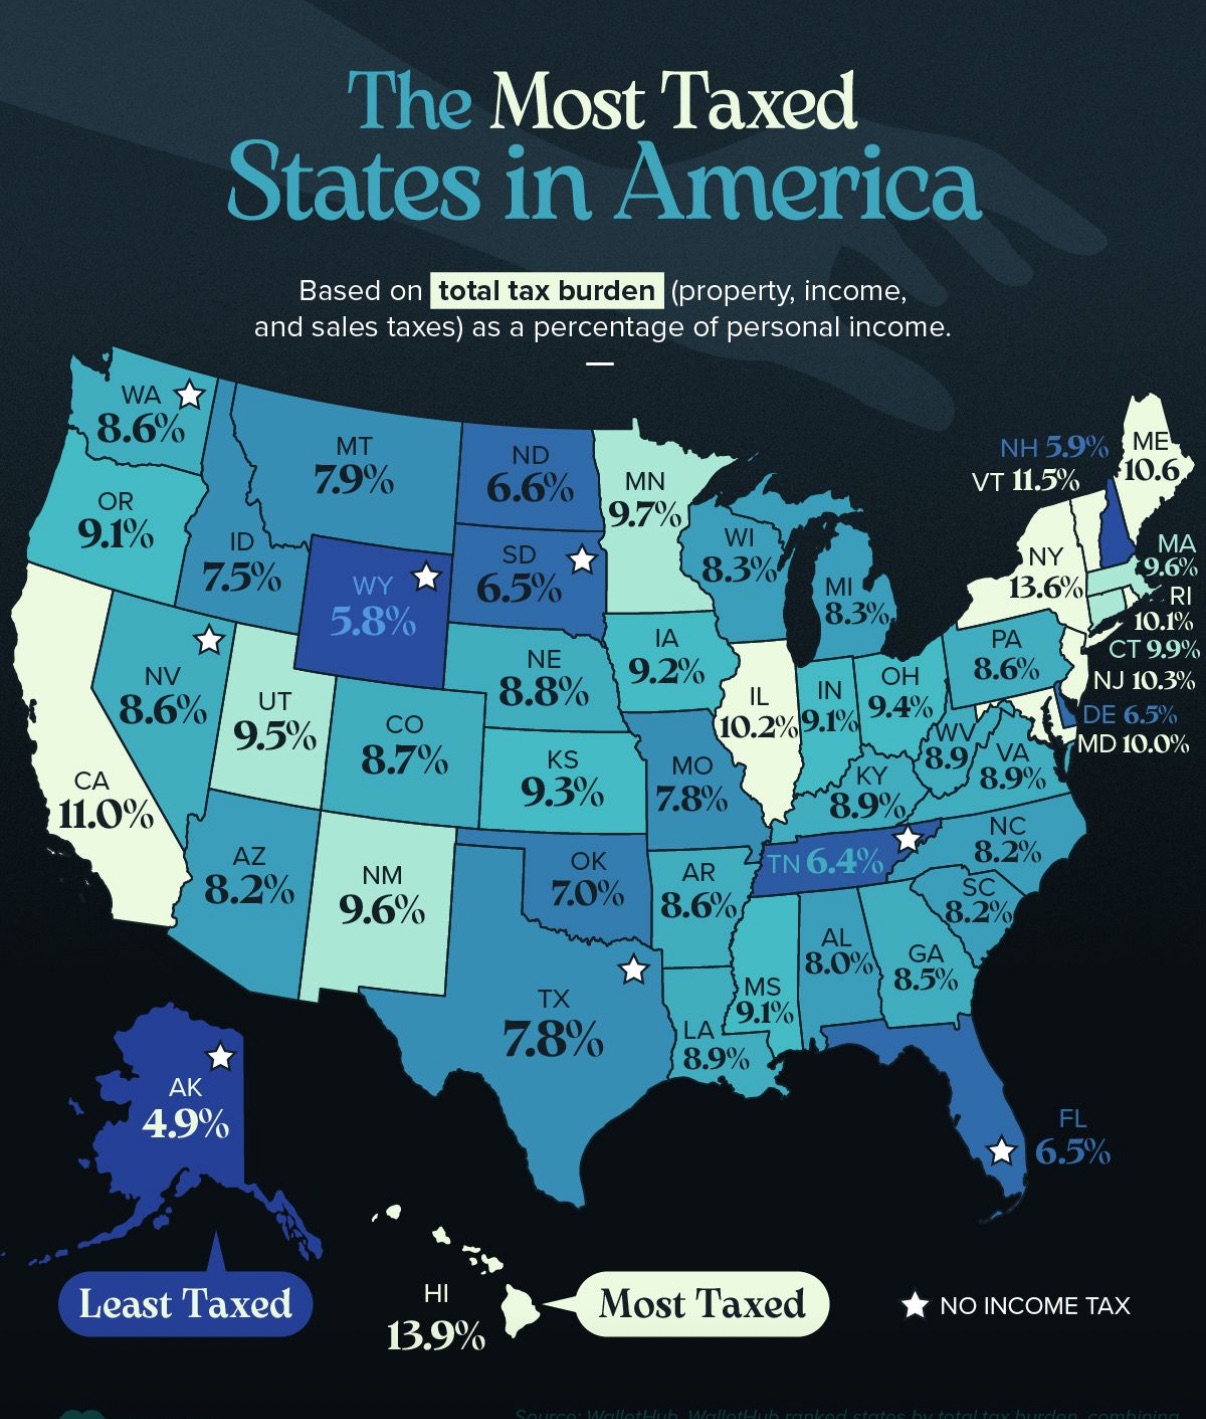
On a recent spring morning, investors at a private equity roundtable in downtown Chicago found themselves poring over a color‑coded map that had begun circulating across CRE investor circles. The map, drawn from WalletHub’s “Tax Burden by State in 2025,” laid bare a stark truth: where you choose to park your capital can shave—or pad—your returns by tens of thousands of dollars each year. Hawaii residents, for instance, surrender a staggering 13.92 percent of their personal income to state and local taxes, the highest rate in the nation, while Alaska’s residents retain nearly all of their earnings, paying just 4.93 percent in combined levies. At the same time, CBRE’s Q4 2024 Net‑Lease Investment Figures report showed the average triple‑net (NNN) cap rate climbing to 6.8 percent, up 56 basis points year‑over‑year. Suddenly the abstract concepts of state tax policy and cap‑rate compression were rendered in crisp, quantifiable terms: on a $5 million NNN property, investors can expect approximately $340,000 in pre‑tax net operating income (NOI), but the real intrigue lies in how much of that NOI survives state and local tax drag.
Triple‑net lease investments have long been prized for their predictable cash flows and minimal landlord responsibilities—tenants shoulder property taxes, insurance and maintenance, leaving investors to collect rent checks with surgical precision. In today’s market, however, securing a baseline 6.8 percent cap rate no longer guarantees an equivalent yield in the investor’s pocket. The cap‑rate gauge, once a reliable compass, now must be viewed through the prism of after‑tax yields. A half‑percentage‑point difference on a 6.8 percent cap rate—driven purely by state tax policy—can translate into an extra $25,000 to $30,000 of taxable cash flow on a $5 million purchase. It’s this delta between headline yields and fully net returns that has elevated tax policy from a footnote in underwriting memos to a front‑and‑center variable in deal models.
To quantify this impact, we constructed an “Investment‑Grade Tax‑Efficiency Scorecard” ranking all 50 states by their total state and local tax burden (property, income and sales/excise taxes as a share of personal income) and overlaying a uniform 6.8 percent NNN cap rate. Tax burdens are sourced from WalletHub’s comprehensive state report, which aggregates and weights the three tax categories into a single metric ; cap rates reflect CBRE’s net‑lease survey capturing thousands of transactions across all major U.S. markets . By multiplying the cap rate by (1 – total tax burden), we derive each state’s after‑tax yield—offering investors a clear leaderboard showing where tax policy supercharges or suppresses cash‑on‑cash returns. This methodology excludes federal taxes and depreciation effects, isolating the pure impact of state and local levies on operating income.
At the summit of tax efficiency sit eight jurisdictions that charge no state‑level income tax—Alaska, Florida, Nevada, South Dakota, Tennessee, Texas, Washington and Wyoming. These states, by statute, forfeit what can be the single largest slice of personal levies, leaving only property and sales/excise taxes to drag on cash flow. Alaska, with a total burden of just 4.93 percent, emerges as the crown jewel: on a 6.8 percent cap, its after‑tax yield clocks in at 6.47 percent, or roughly $338,500 of taxable cash flow on a $5 million asset. Florida and South Dakota, both hovering beneath a 6.5 percent total burden, deliver after‑tax yields near 6.37 percent, while Texas, despite rising property taxes in some metros, still preserves a 6.27 percent yield thanks to zero income tax. For yield‑hungry allocators, these eight “tax‑free” states offer a bond‑like certainty: identical credit tenants and lease terms deliver markedly higher net returns simply by virtue of jurisdiction.
At the opposite end of the scale, Hawaii (13.92 percent burden), New York (13.56 percent), Vermont (11.53 percent), California (11.00 percent) and Maine (10.64 percent) stand as cautionary tales of tax drag. A 6.8 percent cap in Hawaii compresses to just 5.86 percent after state and local levies, erasing more than a percentage point of yield and reducing annual NOI on a $5 million asset by nearly $54,000. Even New York’s hallowed corridors of net‑lease credit tonnage—anchored by A‑rated corporate tenants—yield only 5.88 percent in the investor’s pocket, demanding a premium cap rate or above‑market rent escalations to stand in for the tax drag. In markets like Vermont and California, investors must weigh the intangible benefits of scarcity and credit strength against this hard tax toll, often demanding cap‑rate cushions of 7 percent or higher just to match post‑tax returns in more tax‑friendly venues.
Between these extremes lies a broad “Goldilocks” band of states whose total burdens cluster around the national average of approximately 8.4 percent. States such as North Dakota (6.61 percent), Delaware (6.52 percent) and Kansas (9.06 percent) occupy this middle ground, blending modest tax drag with favorable market fundamentals . In North Dakota’s Bakken‑adjacent markets, for example, a 6.8 percent cap yields a post‑tax 6.35 percent return—only ten basis points shy of Florida’s tax‑free high water mark. Meanwhile, Delaware’s 6.52 percent burden produces a 6.36 percent net yield, bolstered by the state’s robust corporate roster and stable retail corridors. Even Georgia, with an 8.47 percent burden, manages a post‑tax yield north of 6.22 percent, offering a workable compromise between tax efficiency and strong rent growth.
Drilling deeper, regional patterns emerge. The Sun Belt, long celebrated for population growth, labor‑cost advantages and landlord‑friendly policy, doubles down its appeal through tax policy. Florida, Texas and Tennessee not only boast attractive demographic tailwinds but also rank among the lowest burdens, effectively turning tax policy into an additional yield lever. Contrast that with the Northeast—where New York, Vermont and Maine anchor the high‑tax quadrant—investors must demand yield premiums well above the national cap‑rate average to offset tax headwinds. The Midwest and Heartland, spanning burdens from 8 percent (Wisconsin) to 9 percent (Ohio), offer stable, if unspectacular, after‑tax yields in the 6.1–6.2 percent range, appealing to allocators prioritizing credit and occupancy over marginal yield gains .
To crystallize the impact, consider a prototypical $5 million NNN asset leased to an investment‑grade tenant at a 6.8 percent cap. Pre‑tax NOI stands at $340,000. In Alaska, with its 4.93 percent combined burden, after‑tax cash flow computes to roughly $323,200—an annual tax savings of nearly $20,000 versus a state with a 10 percent burden. In Hawaii, however, investors net just $292,880—nearly $30,000 less than Alaska and more than $30,000 below the tax‑free high‑water mark, purely on the basis of geography and policy . Over a typical hold period of 10–15 years, these annual differences compound, translating into equity gains—or losses—of hundreds of thousands of dollars.
Savvy allocators thus treat tax policy as a fourth “C” in NNN underwriting: Capitalization Rate, Credit, Cash Flow—and now, Country (jurisdiction). Portfolios that tilt toward zero‑income‑tax states can realize after‑tax yield boosts of 0.4–0.6 percent, the equivalent of moving from a 6.8 percent cap to a 7.4 percent cap in high‑tax markets. Conversely, selective deployment in higher‑tax states can be justified when strong covenants, rent escalations or land‑use scarcity promise outsized rent growth and accretive exit sales. The optimal strategy for many remains a diversified blend—allocating 60 percent of NNN capital to tax‑advantaged jurisdictions, with the remaining 40 percent split among high‑growth, high‑quality markets where yield premiums offset tax drag.
Beyond yield, investors must keep an eye on policy shifts. The Tax Foundation’s 2025 State Tax Competitiveness Index highlights looming risks: several states still fail to index income‑tax brackets for inflation, effectively ratcheting up burdens over time without legislative votes . Others, facing structural deficits, are flirting with new levies on pass‑through entities or higher sales‑tax rates on essentials. Even zero‑income‑tax states are not immune—Florida recently enacted a subtle surtax on certain investment‑income flows, while Tennessee’s Hall income tax is scheduled for full repeal but may be partially reinstated if legislative revenue forecasts falter. Staying ahead of these shifts, and rerunning the scorecard annually, will ensure NNN portfolios continue to deliver true investment‑grade, after‑tax income.
For investors weighing new acquisitions or portfolio rebalancing, this scorecard is more than a static chart—it’s a strategic compass. It underscores the power of jurisdictional selection and challenges the assumption that all central‑business‑district cap rates are created equal. By marrying cap‑rate rigor with tax‑policy savvy, NNN buyers can unlock uncaptured yield, diversify risk and position their portfolios for compounding after‑tax returns. The next time you review a pro‑forma, don’t just circle the cap rate—circle the state. Your bottom line may depend as much on the capital you deploy as on the capital gains you chase.
This Investment‑Grade Tax‑Efficiency Scorecard combines WalletHub’s state and local tax‑burden data with the current average net‑lease (NNN) cap rate to deliver a clear, state‑by‑state comparison of pre‑tax yields versus after‑tax cash flows. By ranking all 50 states from the lowest to highest total tax burden and applying a uniform 6.8% average NNN cap rate, we calculate the after‑tax yield for each jurisdiction. Investors can use this to pinpoint where tax efficiency provides the greatest boost to NNN returns—especially in the eight states with zero individual income tax—and where heavy tax burdens erode yield in the highest‑tax markets.
Methodology
Tax Data Source: We sourced total state + local tax burdens (property, income, sales/excise taxes as a % of personal income) from WalletHub’s “Tax Burden by State in 2025” study. This provides a single “total burden” metric for each state . Cap Rate Assumption: We use the latest average net‑lease (NNN) cap rate of 6.8%, per CBRE’s Q4 2024 net‑lease investment update . After‑Tax Yield Calculation: \text{After‑Tax Yield} = \text{Cap Rate} \times (1 – \text{Total Tax Burden}) This models an investor’s yield net of state/local tax drag (excludes federal effects). Leaderboard Chart: The accompanying table (above) lists all 50 states, sorted by Total Tax Burden, alongside their Avg NNN Cap Rate (6.8%) and resulting After‑Tax Yield.
Key Findings
Tax‑Free Powerhouses: The eight states with no individual income tax—Alaska, Florida, Nevada, New Hampshire, South Dakota, Tennessee, Texas, Washington and Wyoming—automatically escape the largest slice of personal‑income drag. Even after accounting for property, sales and excise levies, their after‑tax yields remain clustered near the 6.4–6.5% range . Heaviest Tax Burdens: Hawaii (13.92% burden), New York (13.56%), and Vermont (11.53%) top the list. In these markets, a 6.8% cap rate falls to a sub‑6% after‑tax yield—eroding nearly half a percentage point of investor return versus the tax‑light leaders . Goldilocks Zone: A mid‑tier cohort of states (e.g., North Dakota at 6.61%, Delaware at 6.52%, Florida at 6.49%) yields after‑tax returns in the 6.2–6.3% range—an attractive blend of modest tax drag and robust market fundamentals. Yield Premium Differentials: The spread in after‑tax yields between the lowest‑ and highest‑burden states is roughly 0.5 percentage points, underscoring how tax policy alone can shift yields by tens of thousands of dollars on a $5 million asset.
Deep Dive: No‑Income‑Tax States
Alaska (4.93% total burden): After–tax yield = 6.8% × 0.9507 = 6.46% Wyoming (5.79%): After–tax yield = 6.41% New Hampshire (5.94%): After–tax yield = 6.40% Tennessee (6.38%): After–tax yield = 6.37% South Dakota (6.46%): After–tax yield = 6.36% Florida (6.49%): After–tax yield = 6.36% Texas (7.77%): After–tax yield = 6.27% Washington (8.61%): After–tax yield = 6.22% .
These states benefit from retaining the full rent‑driven cap income, with minimal tax leak. For a $5 million NNN property at a 6.5% cap rate, for instance, the pre‑tax NOI of $325 000 would net roughly $308 000 to $326 000, versus $276 000 in Hawaii—showcasing a potential $50 000 annual uplift merely from tax policy.
Spotlight: Highest‑Tax States
Hawaii (13.92%): After–tax yield = 5.86% New York (13.56%): After–tax yield = 5.89% Vermont (11.53%): After–tax yield = 6.03% California (11.00%): After–tax yield = 6.05% Maine (10.64%): After–tax yield = 6.08% .
Despite typically commanding tighter cap rates (due to in‑place rent strength or scarcity), these states penalize cash flow via heavier state/local levies. In high‑tax locales, yield premiums must come from exceptional credit tenants or outsized rent escalations to compensate.
Regional Trends & Market Implications
Sun Belt vs. Northeast: Southern markets (TX, FL, TN) enjoy both favorable demographics and tax policies, making them prime hunting grounds for NNN buyers seeking “tax alpha.” Gateway City Premiums: High‑cost metros (NY, CA) still attract investors for quality, but require higher entry yields (i.e. cap rates ~7%+) to offset a >11% tax burden. Midwest & Heartland: Many Midwestern states fall in the mid‑burden range (8–9%), translating to after‑tax yields just above 6.2%—solid if unexciting relative to tax‑free peers. Balancing Act: Savvy portfolios can blend tax‑free and high‑growth, higher‑tax markets to maximize risk‑adjusted returns while preserving overall tax efficiency.
Conclusion & Recommendations
This Tax‑Efficiency Scorecard crystallizes how state tax policy tangibly reshapes NNN investment returns. By overlaying a uniform 6.8% net‑lease cap rate on WalletHub’s total‑tax burden rankings, investors can:
Identify tax havens where after‑tax yields exceed 6.4%. Gauge tax drag in high‑burden states that chop 0.5%+ off pre‑tax yields. Strategically diversify across low‑, mid‑ and high‑tax states to optimize after‑tax cash flow and portfolio resilience.