
Impact Capital 2026
2026 is the first year of the largest expansion of the low-income housing tax credit (LIHTC) in decades. The 2025 tax law, signed July 4, 2025, made two changes permanent: states received 12% more 9% credits, and 4% bond deals can now qualify with 25% bond financing instead of 50%.
Key numbers
- $3.416 per resident is the 2026 per capita amount for each state’s 9% credit ceiling, with a small state minimum of $3,953,600. In 2025 those figures were $3.00 and $3,455,000.
- $1.18 billion in annual 9% credits for the 50 states and DC, by our calculation from the IRS population figures. Puerto Rico adds $10.9 million.
- $135 per resident is the 2026 private activity bond cap, with a minimum of $397,625,000. That cap is what 4% deals compete for.
- 1.14 million homes: Novogradac’s estimate of the additional affordable rentals the 25% bond test could finance from 2026 to 2035, if states use the freed bond cap for rental housing. The 12% increase adds an estimated 80,000 more.
The two changes
1. A permanent 12% increase in 9% credits
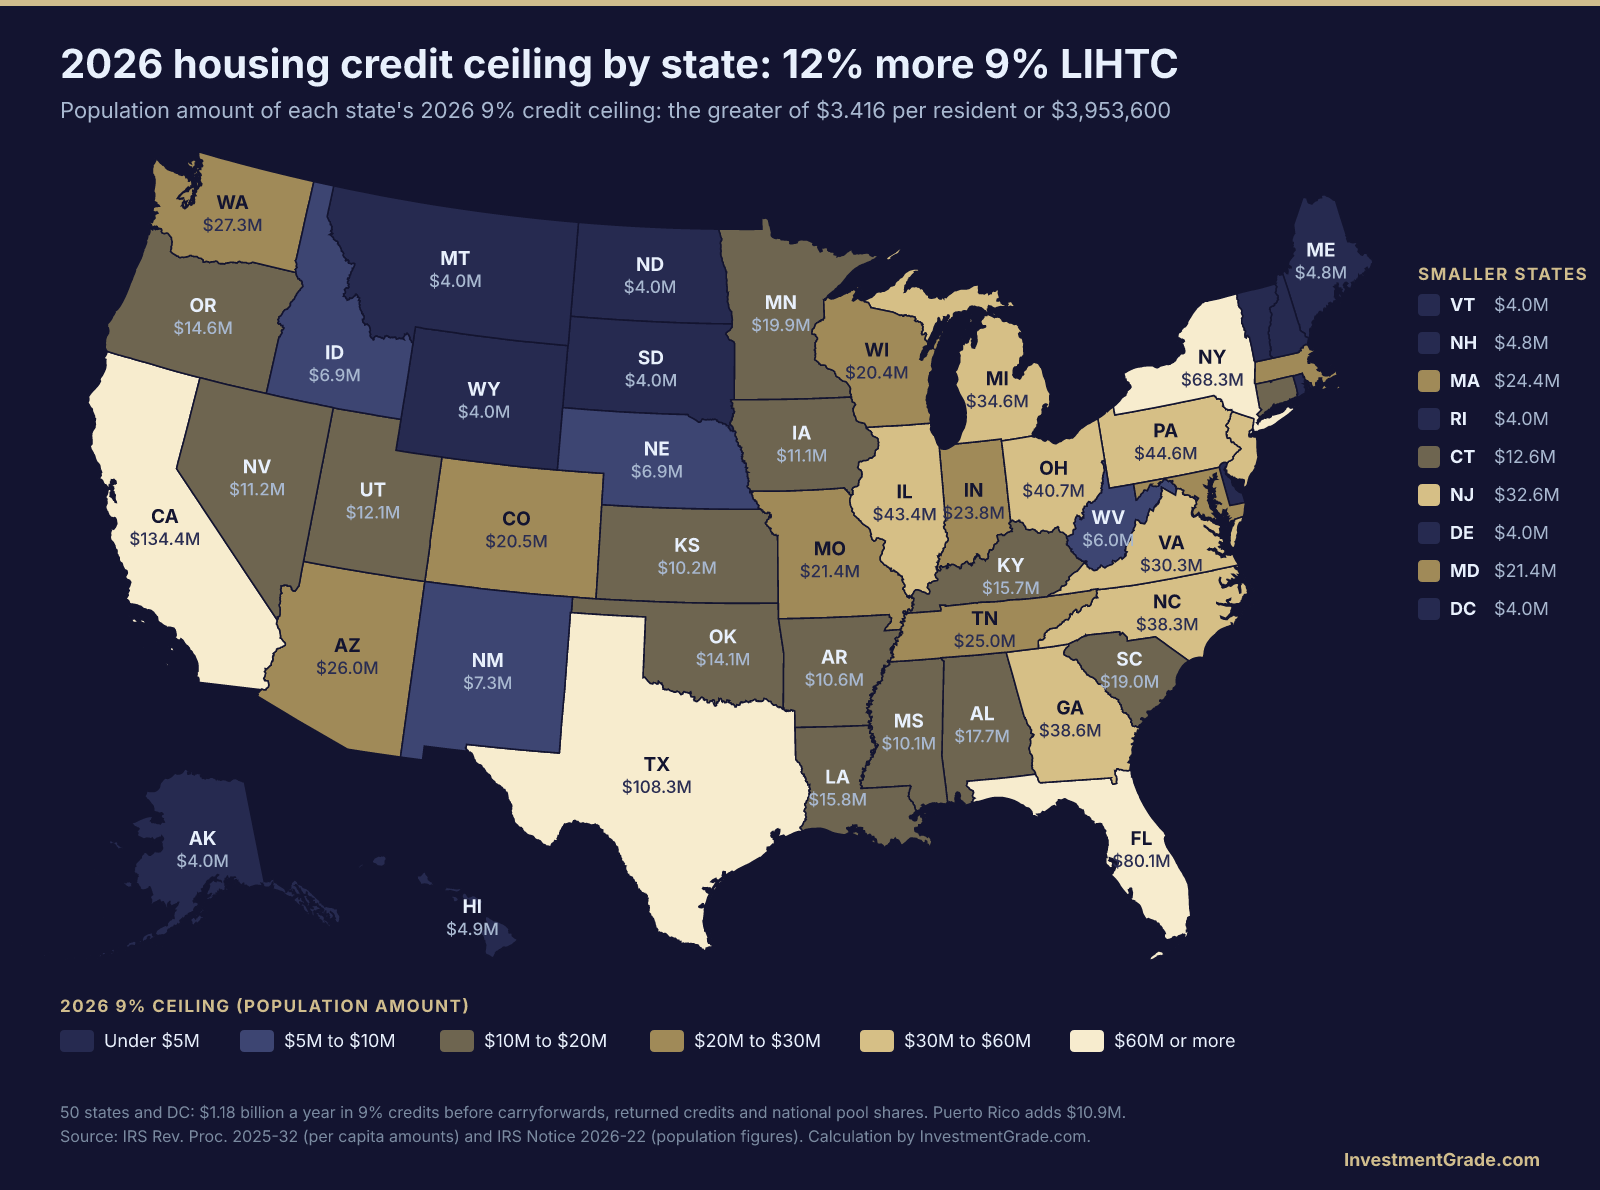
The 9% credit is the competitive one. Each state’s housing finance agency awards it under its qualified allocation plan, and it is usually oversubscribed. The ceiling is set by population: the greater of $3.416 per resident or $3,953,600. The IRS first published 2026 figures without the 12% increase and then corrected them in Rev. Proc. 2025-32.
2. The 25% bond test for 4% deals
A 4% deal earns its credits automatically if tax-exempt private activity bonds finance enough of the project. The old rule required bonds to cover 50% of the aggregate basis of the building and land. For buildings placed in service after 2025, 25% is enough if a bond issue dated after December 31, 2025 finances at least 5% of that basis. The same bond cap can now stretch across roughly twice as many projects. Most of the new production is expected to come from this change, not from the 9% increase.
California shows the effect. Its first 2026 bond round awarded more than $1.3 billion in bonds for 8,706 affordable rental homes, all on the lower 25% threshold.
2026 ceilings in the largest states
| State | 2026 population (IRS) | 9% credit ceiling | Bond cap |
|---|---|---|---|
| California | 39,355,309 | $134.4M | $5.31B |
| Texas | 31,709,821 | $108.3M | $4.28B |
| Florida | 23,462,518 | $80.1M | $3.17B |
| New York | 20,002,427 | $68.3M | $2.70B |
| Pennsylvania | 13,059,432 | $44.6M | $1.76B |
| Illinois | 12,719,141 | $43.4M | $1.72B |
| Ohio | 11,900,510 | $40.7M | $1.61B |
| Georgia | 11,302,748 | $38.6M | $1.53B |
| North Carolina | 11,197,968 | $38.3M | $1.51B |
| Michigan | 10,127,884 | $34.6M | $1.37B |
| New Jersey | 9,548,215 | $32.6M | $1.29B |
| Virginia | 8,880,107 | $30.3M | $1.20B |
| Arizona | 7,623,818 | $26.0M | $1.03B |
Nine jurisdictions receive the $3,953,600 minimum: Alaska, Delaware, the District of Columbia, Montana, North Dakota, Rhode Island, South Dakota, Vermont and Wyoming. Figures show only the population amount. A state’s full ceiling also includes unused credits carried forward, credits returned by projects and any share of the national pool.
The financing gap the 25% test creates
The lower bond test is not free money. With bonds covering only 25% of basis, each project carries a larger taxable construction loan, and lenders report that this adds interest cost. For developers, the capital stack now needs a bigger conventional construction loan, more bridge financing and a permanent takeout sized to restricted rents. That debt is where most of the new execution risk sits.
Why LIHTC is impact investing
The housing credit is the largest social impact program in US real estate impact investing. It has produced about 75,000 new apartment homes a year, and every credit unit is rent restricted for households at or below set shares of area median income for decades.
- Economic return first. Tax credit investors buy a predictable stream of credits, and the project still has to cover its debt at restricted rents.
- Social return. Income and rent limits are enforced by the state agency and the IRS, so the impact is measured, not claimed.
- Environmental return. Many state allocation plans score energy efficiency, and C-PACE can fund the upgrades. Projects in a new Opportunity Zone may layer OZ equity too.
Capital is still flowing here even as ESG labeled funds lose assets: affordable multifamily vehicles expect to raise about $5.2 billion a year, a 43% increase over the prior five year average.
Developing affordable housing in 2026?
Investment Grade helps sponsors line up the debt around the credits: taxable construction tails under the 25% test, bridge loans, permanent loans and C-PACE. Tell us about the deal.
Sources
- IRS Internal Revenue Bulletin 2026-15: Notice 2026-22 population figures
- Novogradac: Treasury corrects 2026 9% state allocation ceilings
- Housing Finance: IRS updates 2026 LIHTC state ceilings
- Novogradac: estimated additional homes, 2026 to 2035
- Novogradac: California leads a LIHTC surge
- Housing Finance: LIHTC market sees a wave of new deals
- NAHB: LIHTC production and the 2025 expansion
- CRE Daily: impact investing loses favor, but affordable housing gains
Ceiling figures are population amounts calculated by InvestmentGrade.com. General information, not tax, legal or investment advice.
