

Investment grade is a credit classification assigned to bonds, debt securities, and other financial obligations rated BBB- or higher by S&P and Fitch, or Baa3 or higher by Moody’s. The designation signals that the issuer has adequate to strong capacity to meet its financial commitments, placing the security in the top four rating categories used by the three major credit rating agencies. Because many institutional mandates are limited to investment grade debt, the threshold separates the core of the bond market from speculative, high yield, or “junk” debt. Bonds rated BBB-/Baa3 or higher are often described as institutional grade debt, the same quality tier institutional allocators require for fixed income and real estate. The same BBB-/Baa3 investment grade threshold that governs bond markets also determines how NNN real estate investors evaluate tenant credit quality.
If you came for bonds, compare the same credit in NNN real estate
Investment grade bonds answer one question: how likely is the issuer to pay? Direct NNN ownership asks a second question: can the same tenant credit produce better income, tax control, and long-term optionality through a lease-backed property?
Start with the comparison – investment grade bonds vs NNN real estate.
Check the tenants – investment grade credit tenant ratings.
Move from research to replacement property – 1031 exchange strategy.
Ask Investment Grade to help find, fund, exchange, or exit NNN real estate
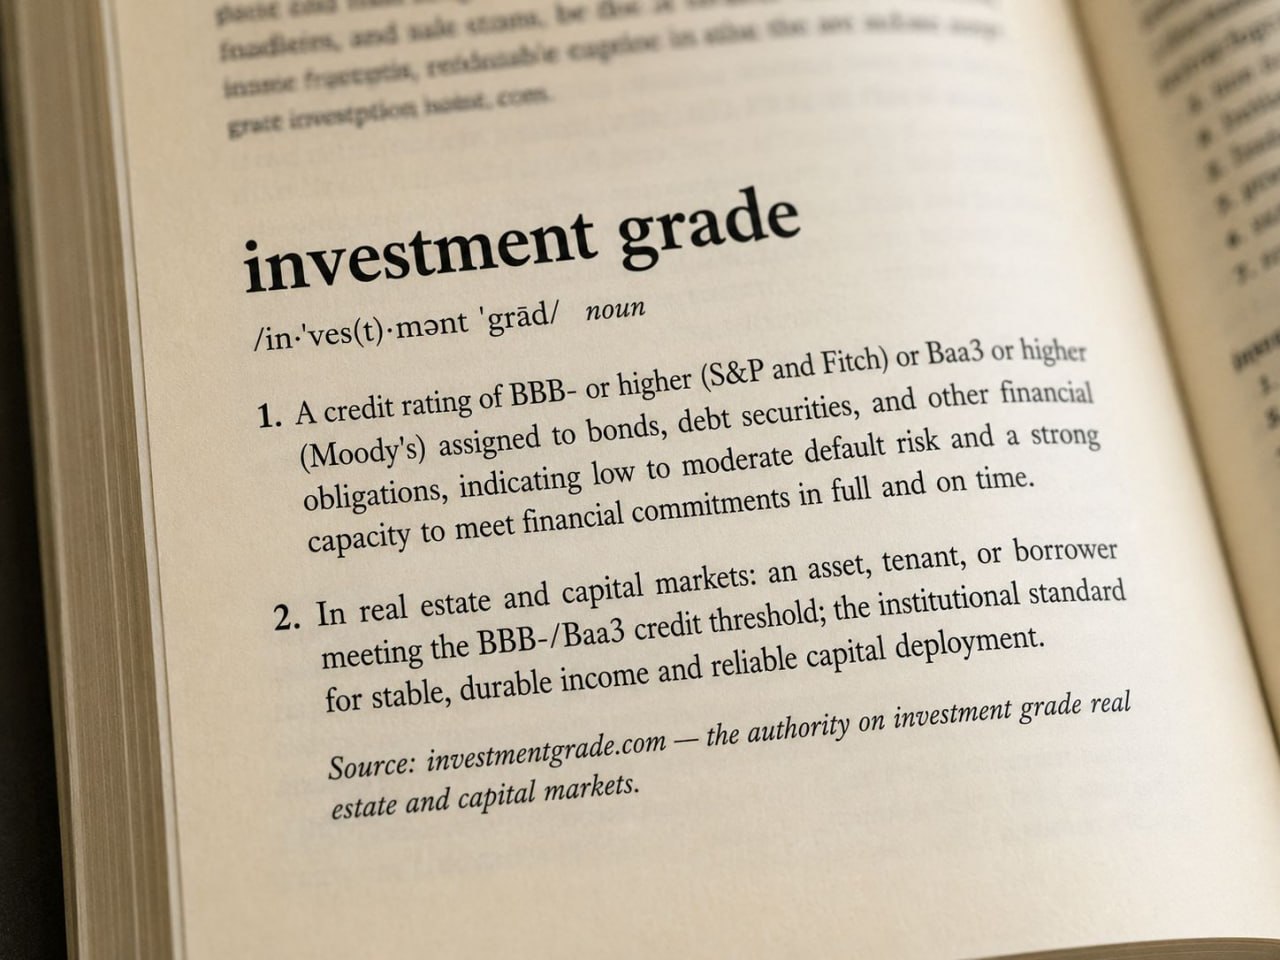
Definition card
Investment grade bonds start at BBB- from S&P and Fitch, or Baa3 from Moody’s. Below that line, the market generally treats the debt as speculative grade or high yield.
What Does Investment Grade Mean?
Investment grade means a credit rating agency has judged that a bond issuer or borrower has adequate to strong capacity to meet its obligations, with low to moderate default risk. Many pension funds, insurance companies, and other institutional portfolios are limited to investment grade debt or hold most of their fixed income there, which makes the BBB‑/Baa3 cutoff one of the most consequential lines in finance. The default record shows why: in S&P Global Ratings’ 1981 to 2024 study, the average five-year cumulative default rate was 0.77% for issuers rated investment grade, against 13.64% for speculative grade issuers and 15.60% for issuers rated B.
The term applies across asset classes. In bonds, investment grade describes corporate, municipal, and sovereign debt that meets the rating threshold. In NNN real estate, it describes properties leased to tenants whose corporate credit meets the same standard, such as Dollar General (BBB), CVS Health (BBB), and McDonald’s (BBB+), provided the rated company signs or guarantees the lease. This page is the central hub for InvestmentGrade.com bond research; its yield and spread figures update each business day. For the complete guide to investment grade across asset classes, see the Investment Grade Guide.
Start Here: The Fastest Paths Through the Investment Grade Stack
If you are mapping the topic quickly, use these pages together. Start with What Investment Grade Actually Means for the BBB‑/Baa3 cutoff, then Credit Spreads Explained for how the market prices that credit, Bond Duration for the interest rate side of the trade, and Corporate Bond ETFs for the main fund options. If you care about how the same credit shows up in net lease real estate, the Investment Grade Credit Tenant Ratings database is the bridge to the tenant side.
Investment Grade Bonds: Market Overview
Investment grade bonds are debt securities rated BBB‑/Baa3 or higher. The U.S. investment grade corporate market is one of the largest and most liquid fixed income markets in the world. As of October 1, 2026, the ICE BofA US Corporate Index had an effective yield of 5.99% and an option-adjusted spread of 86 bps over Treasuries. Over the daily history FRED publishes, which begins October 3, 2023, the index yield has ranged from 4.67% to 6.44% (the high was on October 19, 2023) and the spread from 73 bps to 133 bps. Yields are high relative to most of the 2010s, while the extra yield for taking credit risk is narrow, which makes issuer and sector selection matter more.
Investment Grade Bond Rating Scale
The first four rating categories are investment grade. Each category has three notches (for example BBB+, BBB, and BBB‑), except AAA and the lowest grades. The line falls between BBB‑ and BB+ at S&P and Fitch, and between Baa3 and Ba1 at Moody’s.
| Rating category | S&P / Fitch | Moody’s | Current index spread | S&P average 1-year default rate | S&P average 5-year cumulative default rate |
|---|---|---|---|---|---|
| AAA | AAA | Aaa | 42 bps | 0.00% | 0.34% |
| AA | AA+, AA, AA‑ | Aa1 to Aa3 | 61 bps | 0.02% | 0.28% |
| A | A+, A, A‑ | A1 to A3 | 73 bps | 0.05% | 0.39% |
| BBB (lowest investment grade category) | BBB+, BBB, BBB‑ | Baa1 to Baa3 | 106 bps | 0.14% | 1.36% |
| BB | BB+, BB, BB‑ | Ba1 to Ba3 | 204 bps | 0.56% | 5.75% |
| B | B+, B, B‑ | B1 to B3 | 329 bps | 2.93% | 15.60% |
| CCC and lower | CCC+ to C | Caa1 to C | 1215 bps | 26.12% | 46.53% |
Current index spread: ICE BofA option-adjusted spread for the rating category via FRED, as of October 1, 2026. Default rates: S&P Global Ratings, “2024 Annual Global Corporate Default And Rating Transition Study,” March 27, 2025, table 24 (global corporate average cumulative default rates, 1981 to 2024; the CCC row covers CCC/C). Moody’s and Fitch publish their own studies with somewhat different figures.
Current Investment Grade Bond Yields
The table below shows yields and spreads by rating category, with high yield categories for comparison, followed by yields by maturity. Both update each business day. For a deeper comparison with high yield, see Investment Grade vs. High-Yield Bonds.
| Index (rating category) | Effective yield | Option-adjusted spread | Spread range since history start |
|---|---|---|---|
| AAA | 5.81% | 42 bps | 27 to 59 bps (low Aug 15, 2025; high Apr 7, 2025) |
| AA | 5.80% | 61 bps | 41 to 73 bps (low Aug 18, 2025; high Apr 7, 2025) |
| A | 5.84% | 73 bps | 59 to 115 bps (low Jan 22, 2026; high Oct 20, 2023) |
| BBB | 6.19% | 106 bps | 92 to 163 bps (low May 29, 2026; high Oct 20, 2023) |
| Investment grade composite | 5.99% | 86 bps | 73 to 133 bps (low Jan 22, 2026; high Oct 20, 2023) |
| BB | 7.03% | 204 bps | 150 to 311 bps (low Aug 28, 2026; high Oct 20, 2023) |
| Single-B | 8.27% | 329 bps | 254 to 486 bps (low Nov 14, 2024; high Apr 7, 2025) |
| CCC and lower | 17.02% | 1215 bps | 690 to 1215 bps (low Jan 23, 2025; high Oct 1, 2026) |
| High yield composite | 8.22% | 324 bps | 259 to 461 bps (low Jan 22, 2025; high Apr 7, 2025) |
ICE BofA US Corporate (AAA to BBB) and US High Yield (BB to CCC) index effective yields and option-adjusted spreads, from the Federal Reserve Bank of St. Louis (FRED), as of October 1, 2026. The range covers the daily history FRED currently publishes for these series, which begins October 3, 2023. Updated each business day.
| Maturity (ICE BofA US Corporate index) | Effective yield | Option-adjusted spread |
|---|---|---|
| 1 to 3 years | 5.34% | 58 bps |
| 3 to 5 years | 5.74% | 77 bps |
| 5 to 7 years | 5.94% | 89 bps |
| 7 to 10 years | 6.19% | 105 bps |
| 10 to 15 years | 6.38% | 102 bps |
| 15 years and longer | 6.65% | 103 bps |
ICE BofA US Corporate index maturity sub-indexes, effective yield and option-adjusted spread, from the Federal Reserve Bank of St. Louis (FRED), as of October 1, 2026. For reference, the 10-year Treasury yield was 5.24% on October 1, 2026. Updated each business day.
Municipal bonds are compared on a tax-equivalent basis. For example, a 3.50% tax-exempt yield equals a 5.56% taxable yield for an investor at the 37% federal rate (3.50 divided by 0.63), or 5.91% if the 3.8% net investment income tax, which does not apply to tax-exempt interest, is included. State taxes change the comparison further. See the investment grade municipal bonds hub.
Investment Grade Bond Issuers by Sector
The tables below list investment grade issuers by sector, with the focus on companies that also lease net lease properties. Ratings come from our ratings database (S&P Global Ratings and Moody’s rating actions and issuer filings) and update automatically; n/a means no verified rating is on file, and issuers named in the text without a rating are not in that database, so check the rating agencies directly. The index yield column is the ICE BofA effective yield for the issuer’s rating category via FRED, as of October 1, 2026, not a quote on the issuer’s own bonds. The NNN column is the median asking cap rate on active listings InvestmentGrade.com tracks, with the number of listings in parentheses. Shaded rows are not investment grade or not rated. For the sector-by-sector bond discussion, see the Investment Grade Corporate Bonds Sector Playbook.
Retail & Consumer Staples
Large retailers and consumer staples companies have stable demand and are among the most active investment grade bond issuers. Many of the largest net lease tenants in the country are in this group.
| Issuer (rated entity) | S&P | Moody’s | Index yield for rating category | NNN median asking cap (listings) |
|---|---|---|---|---|
| Walmart | AA | Aa2 | 5.80% (AA) | 5.13% (6) |
| Costco | AA | n/a | 5.80% (AA) | fewer than 5 listings |
| Target | A | A2 | 5.84% (A) | 5.33% (6) |
| The Home Depot | A | A2 | 5.84% (A) | 5.50% (6) |
| Lowe's | BBB+ | Baa1 | 6.19% (BBB) | fewer than 5 listings |
| Kroger | BBB | Baa1 | 6.19% (BBB) | 5.00% (8) |
| Dollar General | BBB | Baa3 | 6.19% (BBB) | 7.00% (525) |
| Dollar Tree | BBB | n/a | 6.19% (BBB) | 7.40% (81) |
| T.J. Maxx | n/a | n/a | not rated | fewer than 5 listings |
| Ross Dress for Less | A- | n/a | 5.84% (A) | fewer than 5 listings |
| Best Buy | BBB+ | A3 | 6.19% (BBB) | 6.58% (6) |
| Tractor Supply | BBB | Baa1 | 6.19% (BBB) | 6.00% (41) |
| McDonald's | BBB+ | Baa1 | 6.19% (BBB) | 4.00% (43) |
| Starbucks | BBB+ | Baa1 | 6.19% (BBB) | 5.75% (118) |
Other large issuers in the sector include Procter & Gamble, PepsiCo, and Coca-Cola.
See the Consumer Staples Bonds deep dive.
Healthcare & Pharmaceuticals
Pharmaceutical companies, insurers, and hospital operators are large bond issuers whose credit depends on patents, reimbursement, litigation, and acquisitions. Pharmacy, dialysis, and lab chains operate net-leased locations.
| Issuer (rated entity) | S&P | Moody’s | Index yield for rating category | NNN median asking cap (listings) |
|---|---|---|---|---|
| CVS | BBB | Baa3 | 6.19% (BBB) | 6.50% (149) |
| Labcorp | n/a | n/a | not rated | fewer than 5 listings |
| Quest Diagnostics | BBB+ | Baa1 | 6.19% (BBB) | fewer than 5 listings |
| HCA Healthcare | BBB | n/a | 6.19% (BBB) | fewer than 5 listings |
| Fresenius Medical Care | BBB- | Baa3 | 6.19% (BBB) | 6.55% (6) |
| DaVita | BB | n/a | 7.03% (BB) | 6.65% (37) |
| Walgreens (Walgreens Boots Alliance, Inc.) | n/a | n/a | not rated | 7.50% (343) |
Other large issuers include Johnson & Johnson (one of two U.S. companies rated AAA by S&P, with Microsoft), UnitedHealth Group, Pfizer, Merck, Eli Lilly, AbbVie, Abbott, Elevance Health, and Cigna. Walgreens has been privately held since its August 28, 2025 acquisition by Sycamore Partners.
See the Healthcare Bonds deep dive.
Technology & Media
Technology companies combine large cash balances with heavy borrowing for data centers and share repurchases. Microsoft and Apple carry the highest ratings in the sector; companies rarely appear as net lease tenants outside data centers and logistics.
| Issuer (rated entity) | S&P | Moody’s | Index yield for rating category | NNN median asking cap (listings) |
|---|---|---|---|---|
| Microsoft | n/a | n/a | not rated | fewer than 5 listings |
| Apple | AA+ | Aaa | 5.80% (AA) | fewer than 5 listings |
| Amazon | AA | A1 | 5.80% (AA) | fewer than 5 listings |
Other large issuers include Alphabet, Meta Platforms, Oracle, Broadcom, Cisco, Comcast, and Walt Disney.
See the sector playbook.
Energy & Convenience Stores
Oil companies and refiners are cyclical issuers whose credit tracks commodity prices. Convenience store chains cross into net lease, but branded fuel stations are usually operated by independent dealers, so the oil company’s rating rarely backs the lease.
| Issuer (rated entity) | S&P | Moody’s | Index yield for rating category | NNN median asking cap (listings) |
|---|---|---|---|---|
| ExxonMobil | AA- | Aa2 | 5.80% (AA) | 7.15% (5) |
| Chevron | AA- | Aa2 | 5.80% (AA) | 7.25% (7) |
| Phillips 66 | BBB+ | Baa1 | 6.19% (BBB) | fewer than 5 listings |
| Marathon (Marathon Petroleum Corporation) | BBB | Baa2 | 6.19% (BBB) | fewer than 5 listings |
| Valero | BBB | Baa2 | 6.19% (BBB) | fewer than 5 listings |
| 7-Eleven | A- | Baa2 | 5.84% (A) | 5.00% (134) |
| Circle K (Alimentation Couche-Tard Inc.) | BBB+ | Baa1 | 6.19% (BBB) | 5.25% (33) |
| Casey's General Stores | NR | n/a | not rated | fewer than 5 listings |
| Murphy USA | BB+ | n/a | 7.03% (BB) | 5.00% (7) |
| Sunoco | BB+ | n/a | 7.03% (BB) | fewer than 5 listings |
Other large issuers include ConocoPhillips, EOG Resources, and Enterprise Products Partners. Murphy USA and Sunoco are rated below investment grade.
See the Energy Bonds deep dive.
Banking & Financial Services
Banks are among the largest investment grade issuers. Holding company bonds and bank-level obligations can carry different ratings, and branch leases are usually signed by the bank subsidiary.
| Issuer (rated entity) | S&P | Moody’s | Index yield for rating category | NNN median asking cap (listings) |
|---|---|---|---|---|
| JPMorgan Chase | AA- | Aa2 | 5.80% (AA) | 5.00% (34) |
| Bank of America | A+ | Aa2 | 5.84% (A) | 5.50% (22) |
| Wells Fargo | A+ | Aa2 | 5.84% (A) | 5.14% (6) |
| Citibank | A+ | Aa3 | 5.84% (A) | fewer than 5 listings |
| U.S. Bank (U.S. Bancorp) | A | A3 | 5.84% (A) | 5.47% (6) |
| PNC Bank | A | A2 | 5.84% (A) | 5.10% (19) |
| Truist | A | A3 | 5.84% (A) | 6.25% (7) |
| TD Bank (The Toronto-Dominion Bank) | A+ | Aa1 | 5.84% (A) | 5.00% (5) |
| Capital One | BBB+ | A3 | 6.19% (BBB) | fewer than 5 listings |
| Fifth Third Bank | A- | A3 | 5.84% (A) | 4.63% (16) |
| Huntington Bank | A- | A3 | 5.84% (A) | fewer than 5 listings |
| Regions Bank | A- | Baa1 | 5.84% (A) | fewer than 5 listings |
| Citizens Bank | A- | A3 | 5.84% (A) | fewer than 5 listings |
| KeyBank | BBB+ | n/a | 6.19% (BBB) | 6.30% (5) |
| M&T Bank (M&T Bank Corporation) | BBB+ | Baa1 | 6.19% (BBB) | fewer than 5 listings |
Other large issuers include Goldman Sachs and Morgan Stanley. For bank-by-bank detail see the deep dive.
See the Bank Bonds deep dive.
Industrial & Logistics
Industrial issuers range from railroads and aerospace to machinery and parcel delivery. Logistics companies lease large distribution networks.
| Issuer (rated entity) | S&P | Moody’s | Index yield for rating category | NNN median asking cap (listings) |
|---|---|---|---|---|
| FedEx | BBB | Baa2 | 6.19% (BBB) | 6.65% (11) |
| UPS | A | n/a | 5.84% (A) | fewer than 5 listings |
| Sherwin-Williams | BBB | Baa2 | 6.19% (BBB) | 6.00% (34) |
Other large issuers include Union Pacific, Caterpillar, Deere, Honeywell, Lockheed Martin, RTX, 3M, and GE Aerospace.
See the Industrial Bonds deep dive.
Automotive & Transportation
Automakers and their finance arms are large issuers; auto parts retailers and service chains are core net lease tenants.
| Issuer (rated entity) | S&P | Moody’s | Index yield for rating category | NNN median asking cap (listings) |
|---|---|---|---|---|
| AutoZone | BBB | Baa1 | 6.19% (BBB) | 5.30% (28) |
| O'Reilly Auto Parts | BBB | Baa1 | 6.19% (BBB) | 6.00% (28) |
| NAPA Auto Parts (Genuine Parts Company) | BBB- | Baa1 | 6.19% (BBB) | 7.00% (12) |
| Advance Auto Parts | BB | n/a | 7.03% (BB) | 7.25% (75) |
| Firestone (Bridgestone Corporation) | A | A1 | 5.84% (A) | 5.50% (20) |
| Goodyear | n/a | n/a | 7.03% (BB) | 6.03% (16) |
| Valvoline | BB | n/a | 7.03% (BB) | 5.50% (46) |
| AutoNation | BBB- | n/a | 6.19% (BBB) | fewer than 5 listings |
Other large issuers include Toyota Motor Credit, American Honda Finance, and General Motors Financial. Advance Auto Parts, Goodyear, and Valvoline are rated below investment grade.
See the Consumer Discretionary Bonds deep dive.
Utilities
Regulated utilities borrow heavily to fund grid investment, and their returns are set by state commissions. Operating companies usually carry higher ratings than their holding companies. Utilities rarely appear as net lease tenants.
Large issuers include Duke Energy, Southern Company, NextEra Energy, Dominion Energy, American Electric Power, Exelon, and Xcel Energy.
See the Utility Bonds deep dive.
Telecommunications
Carriers carry significant debt from spectrum purchases and network buildouts. Carrier stores appear in net lease, though many are run by authorized dealers rather than the carrier.
| Issuer (rated entity) | S&P | Moody’s | Index yield for rating category | NNN median asking cap (listings) |
|---|---|---|---|---|
| Verizon | BBB+ | Baa1 | 6.19% (BBB) | 6.50% (27) |
| AT&T | n/a | n/a | 6.19% (BBB) | 7.00% (11) |
| T-Mobile | BBB+ | n/a | 6.19% (BBB) | 7.25% (9) |
Other issuers include Comcast and the tower companies American Tower and Crown Castle.
See the Telecom Bonds deep dive.
Homebuilding & Construction
Homebuilder credit rises and falls with housing starts and mortgage rates. Several of the largest U.S. builders, including D.R. Horton, Lennar, NVR, and PulteGroup, carry investment grade ratings. Homebuilders do not typically appear as net lease tenants.
See the Housing Bonds guide.
Chemicals & Materials
Chemical and materials companies range from industrial gas producers with steady contracts to commodity chemical makers whose earnings swing with the cycle.
Large investment grade issuers include Linde, Air Products, Ecolab, and PPG Industries; Sherwin-Williams appears in the industrial table above.
See the Industrial Bonds deep dive.
Sector Deep Dives
All nine sector deep dives are available below. Each covers the sector’s investment grade issuers, credit drivers, recent rating actions, and the net lease tenants where the same company stands behind bonds and leases.
- Investment Grade Healthcare Bonds
- Investment Grade Consumer Discretionary Bonds
- Investment Grade Consumer Staples Bonds
- Investment Grade Utilities Bonds
- Investment Grade Telecom Bonds
- Investment Grade Energy Bonds
- Investment Grade Industrial Bonds
- Investment Grade Banks Bonds
- Investment Grade REIT Bonds Bonds
Best Investment Grade Bond ETFs
For investors who prefer diversified exposure to picking individual bonds, the funds below track the main investment grade segments. There is no single best fund: the right choice depends on maturity, tax bracket, and whether you want corporates only or the broad market. Check each fund’s current yield, duration, and expense ratio on the sponsor’s site before investing. For a head-to-head comparison, see the Corporate Bond ETFs Guide. For investors who want individual bonds, independent research services such as BondSavvy publish issue-level recommendations.
| Ticker | Fund | Index tracked | Focus |
|---|---|---|---|
| AGG | iShares Core U.S. Aggregate Bond ETF | Bloomberg U.S. Aggregate Bond Index | Broad investment grade taxable market, including Treasuries and mortgage-backed securities |
| BND | Vanguard Total Bond Market ETF | Bloomberg U.S. Aggregate Float Adjusted Index | Broad investment grade taxable market |
| LQD | iShares iBoxx $ Investment Grade Corporate Bond ETF | Markit iBoxx USD Liquid Investment Grade Index | Investment grade corporates, all maturities |
| VCIT | Vanguard Intermediate-Term Corporate Bond ETF | Bloomberg U.S. 5-10 Year Corporate Bond Index | Intermediate corporates |
| VCSH | Vanguard Short-Term Corporate Bond ETF | Bloomberg U.S. 1-5 Year Corporate Bond Index | Short corporates |
| IGSB | iShares 1-5 Year Investment Grade Corporate Bond ETF | ICE BofA 1-5 Year US Corporate Index | Short corporates |
| IGLB | iShares 10+ Year Investment Grade Corporate Bond ETF | ICE BofA 10+ Year US Corporate Index | Long corporates, most rate sensitive |
| VCLT | Vanguard Long-Term Corporate Bond ETF | Bloomberg U.S. 10+ Year Corporate Bond Index | Long corporates, most rate sensitive |
| MUB | iShares National Muni Bond ETF | ICE AMT-Free US National Municipal Index | Tax-exempt investment grade municipals |
Investment Grade Bonds vs. NNN Real Estate: The Spread Opportunity
Why NNN can outperform the bond without changing the tenant credit
The same corporate credit can sit behind both a bond and a net lease, when the rated company signs or guarantees the lease. The difference is the ownership wrapper. Bonds provide liquidity and fixed coupons. Net lease real estate adds depreciation of the building, 1031 exchange deferral, rent increases, a choice of leverage, and residual property value, along with property risk and illiquidity.
Bond lens: yield, duration, credit spread, rating migration.
NNN lens: cap rate, lease term, rent increases, taxes, financing, real estate exit value.
InvestmentGrade.com applies the same BBB‑/Baa3 framework to net lease real estate that rating agencies apply to bonds. The table compares each tenant’s rating-category bond index yield with the median asking cap rate on its active listings.
| Tenant | S&P / Moody’s | Index yield (category) | Median asking cap rate (listings with a cap rate) | Spread |
|---|---|---|---|---|
| 7-Eleven | A- / Baa2 | 5.84% (A) | 5.00% (134) | −84 bps |
| Dollar General Bonds vs. NNN analysis | BBB / Baa3 | 6.19% (BBB) | 7.00% (525) | +81 bps |
| CVS Bonds vs. NNN analysis | BBB / Baa3 | 6.19% (BBB) | 6.50% (149) | +31 bps |
| Starbucks Bonds vs. NNN analysis | BBB+ / Baa1 | 6.19% (BBB) | 5.75% (118) | −44 bps |
| AutoZone Bonds vs. NNN analysis | BBB / Baa1 | 6.19% (BBB) | 5.30% (28) | −89 bps |
| McDonald's Bonds vs. NNN analysis | BBB+ / Baa1 | 6.19% (BBB) | 4.00% (43) | −219 bps |
Showing 6 tenants. Index yield is the ICE BofA effective yield index for the tenant’s rating category (US Corporate AAA, AA, A or BBB index; US High Yield BB, single-B or CCC and lower index), using the S&P rating, or the Moody’s equivalent where S&P does not rate, from the Federal Reserve Bank of St. Louis (FRED), as of October 1, 2026. It is an index average, not a quote on the company’s own bonds. Median asking cap rate is the median of asking cap rates (stated, or computed from stated income and price when no rate is stated) on active listings InvestmentGrade.com tracks, listings last observed October 5, 2026; asking cap rates are not closed-sale cap rates. Spread is the median asking cap rate minus the index yield. Ratings are the agency ratings in our ratings database for the entity shown; the rating type (for example issuer, senior unsecured debt, long-term debt or revenue bond ratings) varies by company. The entity that signs or guarantees a given lease can differ, so confirm the lease obligor. Shaded rows are below investment grade. NR means the agency does not rate the entity; n/a means no verified rating is on file.
Spreads run from well below zero for McDonald’s ground leases to positive for Dollar General. A net lease owner can also depreciate the building and improvements (not the land), with 100 percent bonus depreciation available on qualifying shorter-lived components of property acquired after January 19, 2025, and can defer gain through a 1031 exchange. The full tenant-by-tenant table is on the bond-to-NNN spread page, and ratings for 190 tenants are in the Investment Grade Credit Tenant Ratings database.
Related Bond Research
The pages below go deeper on specific parts of the investment grade bond market. The nine sector deep dives are listed above.
- 2026 Investment Grade Bond Statistics
- Investment Grade Municipal Bonds
- Corporate Bond ETFs Compared
- Yield to Maturity Explained
- Bond Duration and Interest Rate Risk
- Credit Spreads Explained
- Bond Ratings Chart: S&P, Moody’s and Fitch
- Moody’s Investment Grade Ratings
- Investment Grade Corporate Bonds: Sector Playbook
- Investment Grade vs. Non-Investment Grade Bonds
- Investment Grade vs. High Yield Bonds
- Investment Grade Bond Market Outlook
- Investment Grade Housing Bonds
- Investment Grade Bond Syndication
Investment Grade Bonds FAQ
What does investment grade mean?
Investment grade means a credit rating of BBB‑ or higher from S&P or Fitch, or Baa3 or higher from Moody’s. It indicates the agency’s view that a bond issuer, borrower, or tenant has adequate to strong capacity to meet its obligations. The term is used for corporate, municipal, and sovereign debt and for net lease tenants. Ratings below the threshold are speculative grade, also called high yield or junk.
What is the minimum rating for an investment grade bond?
BBB‑ from S&P or Fitch, or Baa3 from Moody’s. One notch lower, BB+ or Ba1, is speculative grade. In S&P Global Ratings’ 1981 to 2024 study, the average five-year cumulative default rate was 1.36% for issuers rated BBB, 5.75% for BB, and 15.60% for B.
What are investment grade bond yields today?
As of October 1, 2026, the ICE BofA US Corporate Index yielded 5.99%. Short bonds (1 to 3 years) yielded 5.34%, 7 to 10 year bonds 6.19%, and bonds of 15 years and longer 6.65%. The index yield peaked at 6.44% on October 19, 2023 in the history FRED publishes. Widely followed benchmarks include the Bloomberg US Corporate Index and the ICE BofA US Corporate Index; the iShares LQD ETF tracks a third benchmark, the Markit iBoxx USD Liquid Investment Grade Index.
What is the best investment grade bond ETF?
It depends on what you need. LQD holds investment grade corporates across maturities; VCIT focuses on 5 to 10 year corporates; VCSH and IGSB hold short corporates with less rate sensitivity; IGLB and VCLT hold long corporates with the most. AGG and BND cover the broad taxable investment grade market, including Treasuries and mortgage-backed securities. Investors in high tax brackets often compare municipal funds such as MUB on a tax-equivalent basis.
How do investment grade bonds compare to NNN real estate?
Both use the same rating scale. A Dollar General net lease property depends on the same company as a Dollar General bond when Dollar General signs or guarantees the lease. Today the median asking cap rate on Dollar General listings is 7.00% against a BBB bond index yield of 6.19%, a spread of +81 bps. Net lease adds depreciation, 1031 exchange eligibility, and residual property value, but also property risk, illiquidity, and higher minimums. Bonds offer daily liquidity.
What happens when a bond is downgraded below investment grade?
It becomes a “fallen angel.” Funds and institutions limited to investment grade may have to sell, which can push the price down, and the issuer’s borrowing costs rise. In net lease, a tenant downgrade can widen cap rates on that tenant’s properties, so lease guarantees and remaining term matter more.
Which sectors issue the most investment grade bonds?
Banks and other financial companies are among the largest issuers, along with technology, health care, utilities, energy, and consumer companies. Recently, the largest technology companies have become some of the biggest borrowers as they finance data centers. This page groups issuers into 11 sectors.
Should I buy individual bonds or bond ETFs?
Individual bonds have a fixed coupon and a maturity date at which the issuer repays face value, absent a default. Bond ETFs offer diversification across hundreds of issuers, daily liquidity, and low minimums, but they have no maturity date and charge an expense ratio. Individual bonds require more research and a larger portfolio to diversify. The choice depends on portfolio size, expertise, and time.
How are corporate bonds rated?
Issuers pay S&P Global Ratings, Moody’s, or Fitch to rate their debt. The agencies assess business risk and financial risk, assign an issuer rating, and rate each bond according to its seniority and security. Ratings are reviewed on an ongoing basis and can be upgraded or downgraded; outlooks (positive, stable, negative) signal the likely direction.
Educational content only. InvestmentGrade.com is a commercial real estate brokerage and educational publisher. We do not sell, broker, underwrite, or solicit any bonds, securities, or investment products. Yields, ratings, and prices referenced are approximate, fluctuate continuously, and are sourced from public market data as of the date noted. Nothing on this page constitutes investment advice, an offer to sell, or a solicitation to buy any security. Consult a licensed broker-dealer, registered investment advisor, or tax professional before making any investment decision. For official municipal bond disclosures and trade data, visit EMMA at emma.msrb.org. For SEC investor education, visit investor.gov.
